St. John vs. Crown Point: What the Median Price Doesn't Tell You
August 13, 2026
August 13, 2026
A buyer sat down last month with two browser tabs open, one for St. John and one for Crown Point, trying to figure out which town actually cost less. The St. John tab showed a median sale price near $440,000. The Crown Point tab showed something closer to $330,000 to $400,000 depending on which source she trusted. She closed both tabs more confused than when she started, because the gap looked too big to be about ten minutes of extra drive time.
It isn't about drive time. It's about what each number is actually counting.
Start with St. John. Over the three months ending May 2026, homes there sold for a median of $440,000, up 5.2% from the same period a year earlier, and the average sale price for a single month came in at $428,000, up 4.3% year over year. Zillow's home value estimate for the town told a quieter story: $432,472, up just 0.1% over the past year. Two legitimate sources, same town, same rough dollar figure, wildly different growth stories, because one measures actual closed sales and the other estimates value across the entire existing housing stock.
Crown Point has its own version of that mismatch. Zillow put its typical home value at $362,362 as of May 2026, up 1.4% year over year. Redfin's average sale price for the same window came in lower, around $315,000, down 0.55% from the prior year. Movoto's May 2026 figure landed in between at $399,900. None of these sources are wrong. They're measuring different slices of the same market.
That inconsistency is the first clue that a single median tells you almost nothing about what you'd actually pay for a comparable home in either town.
Here's where it gets interesting. Lake County MLS data from March 2026 broke Crown Point's sales down by property type: detached single-family homes sold for a median of $430,000, with 56 days on market and sellers collecting 99.2% of their original list price. Attached homes, meaning townhomes and condos, sold for a median of $307,450 over the same stretch, sitting 58 days and collecting 98.2% of list. Zoom in further and Crown Point's condo segment moved even faster, with a recent Redfin snapshot showing a $240,000 median list price and roughly 11 days on market.
Set that detached figure, $430,000, next to St. John's $428,000 to $440,000 range from the same general window, and the two towns are practically the same market for the same product.
| Segment | Median | Days on Market | Period |
|---|---|---|---|
| Crown Point, detached | $430,000 | 56 | March 2026, Lake County MLS |
| Crown Point, attached | $307,450 | 58 | March 2026, Lake County MLS |
| Crown Point, condo | $240,000 | 11 | Recent 2026 snapshot |
| St. John, nearly all detached | $428,000-$440,000 | 35 | May 2026 |
The towns aren't priced differently. Their inventory is shaped differently, and that shape is doing the work the headline number gets credit for.
Crown Point's town-wide median gets pulled down because its recent inventory includes a meaningful mix of condos, townhouses, and multi-family units alongside detached houses. St. John's sales mix doesn't carry that same lower tier. Its housing stock skews so heavily toward newer detached construction that there's little left to drag the median toward the floor.
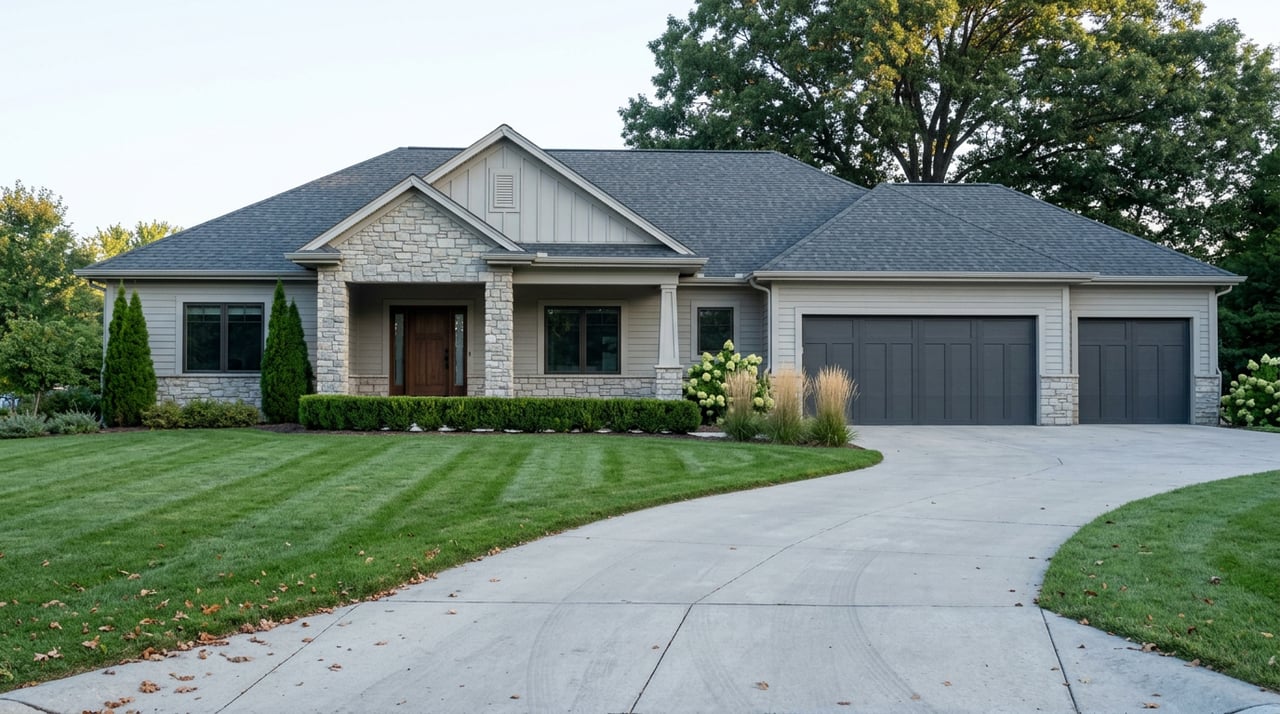
You can see the mechanism by looking at what's actually being built. In St. John, the growth has concentrated in a handful of large-scale developments. The Preserve sits on more than 100 acres of ponds, trails, and open space near I-394, feeding into the Lake Central school district. The Gates of St. John spans 700 acres and has drawn a mix of builders, including Phillippe Builders and D.R. Horton, with recent inventory ranging from single-story ranch plans to the Maple Gate townhome community. Buyers wanting more privacy have gravitated toward The Continental, the town's only gated community.
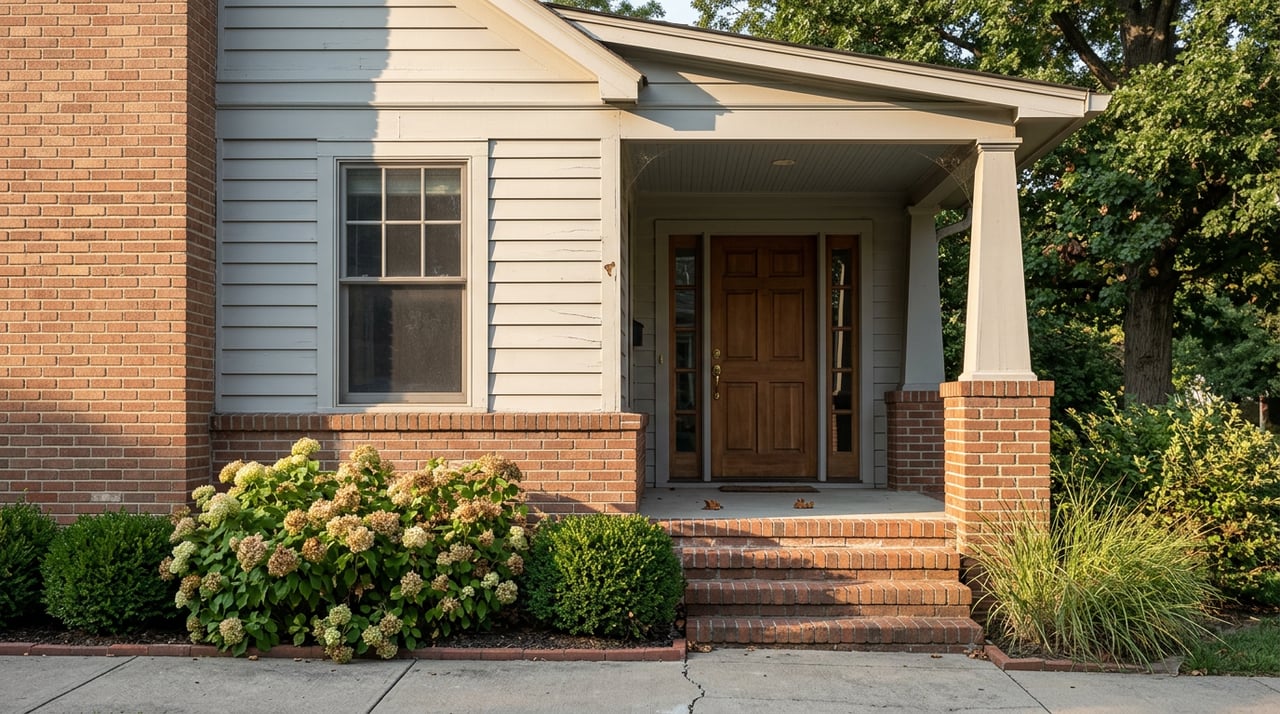
Crown Point's new construction is real, but it's layered on top of a much older base. Olthof Homes has been building out Walkerton Park and The Willows, and Wellspring at the Fountains has added a new townhome community to the city's inventory. Copper Creek, in the city's southwest corner near Crown Point High School, is another newer pocket. None of that replaces the fact that Crown Point still has neighborhoods like Creek, where recent neighborhood-level home value data put the median around $264,000, sitting alongside Ellendale Farm, where the median runs closer to $596,000. That's a more than two-to-one spread inside one city limit. St. John doesn't have an equivalent low end, and its overall housing stock ranks among the newest in the nation, which leaves little older inventory around to pull the median down.
If you're comparing "St. John" to "Crown Point," you're really comparing a town built almost entirely in the last two decades to a town where a home built generations ago and one finished this year can sit three streets apart.
Days on market tells you more about supply pressure than price does, and here the towns diverge in a way that's worth sitting with. As of the most recent Redfin snapshot, St. John's typical time on market had fallen to 35 days, down from 66 days a year earlier, even as home values barely moved on the Zillow index. That's a market where roughly the same type of home, priced roughly the same, is getting scooped up twice as fast. Demand intensified for a supply that didn't really change shape.
Crown Point's pace moved the opposite direction, if only slightly. Movoto tracked average days on market rising from 47 to 51 between May 2025 and May 2026, even as sales volume climbed from 390 to 492 homes sold in the month. More homes changed hands, but each one took a bit longer to find its buyer, likely because Crown Point's mixed inventory means buyers are shopping across a wider spread of price points and property types before committing.
For a buyer, that means the two towns reward different strategies. In St. John, where the inventory is more uniform, a serious offer needs to move fast because the pool of comparable new-construction homes is narrow and buyers are competing for the same handful of floor plans. In Crown Point, a buyer has more room to shop segments against each other, comparing a condo, a townhome, and a detached resale before landing on the one that fits.
Sticker price convergence doesn't mean the monthly cost converges too. Indiana's constitutional cap limits homestead property tax to 1% of assessed value, which is one of the stronger caps in the country, but that cap applies to a tax bill built from local taxing district rates, not a flat statewide number. Lake County's own data shows how much that district-by-district variation matters: the county's median annual property tax bill sits at $5,774, well above the national median of $2,400, but that county-wide figure hides a swing from $1,886 in Shelby to $8,624 in Munster. Crown Point's own median effective property tax rate runs about 1.03%, just above the national median of 1.02%, and its reported median annual bill of $2,761 reflects how homestead exemptions typically reduce assessed value well below market value before the rate is even applied.
The official Indiana Department of Local Government Finance rate tables break rates down by township, and that's the level worth checking, not the town name on the listing. A St. John home and a Crown Point home priced identically can still land on different tax districts with different school and infrastructure bonds layered in, and that difference shows up in the escrow line long before it shows up in any headline comparison.
Is St. John really more expensive than Crown Point? Only if you're comparing the towns as wholes. Compare detached homes specifically and the two markets were within a few percentage points of each other as of spring 2026. The gap in town-wide medians comes from Crown Point having a larger share of lower-priced attached homes and condos in its overall sales mix.
Why did homes in St. John start selling so much faster this year? The most recent Redfin snapshot shows typical time on market at 35 days, down from 66 days a year earlier, even though home values were flat to slightly up on Zillow's index over the same stretch. That points to more buyers competing for a supply that didn't expand much, rather than the market getting objectively cheaper or more attractive.
Where can I still find a lower entry point in either town? Crown Point has more room here. Its condo segment recently carried a median list price around $240,000 with homes moving in about 11 days, and neighborhoods like Creek have sold well below the city median. St. John's inventory is concentrated enough in new detached construction that a comparable entry point is harder to find within town limits.
If you're trying to figure out which segment of either market actually fits your budget, that's the conversation worth having before you fall in love with a floor plan. The Ruvoli Group works both markets closely enough to know which subdivision, which street, and which property type is driving the number you're staring at. Request Your Free Home Marketing Plan and Frank Ruvoli will walk you through what your specific budget actually buys in St. John and Crown Point right now.
Stay up to date on the latest real estate trends.


I have specific knowledge of creating go-to-market strategies that will get your home seen and sold. Customer service is our highest priority! We are here to help you every step of the way in your buying or selling experience.
Get In Touch With Our Team To Learn More

855 E NORTH ST CROWN POINT IN 46307